Performance
High Performance Audit
Performance originates beneath the surface.

Two athletes walk into the room. Same body composition. Same squat numbers. Same aerobic metrics.
From the outside, identical.
One of them will be performing at this level in five years. The other will be managing injuries, chasing numbers they used to own, and wondering what happened.
The difference is not visible from the outside. It is visible in a blood draw.
One is adapted. The other is surviving.
THE LIE
Performance culture has a myth that will not die: to operate at the highest level, you must sacrifice your health. You hear it in locker rooms, team briefings, every founder’s war story—the language of noble suffering. Train harder. Absorb more. The body will figure it out.
It won’t.
Selye documented this sixty years ago.
Every stressor has a threshold.
Below it, the organism adapts. Above it, the organism degrades.
That line is not a suggestion. It is physiology. And crossing it without knowing where it is — is leaving adaptation on the table.
Yet the truth is more demanding than the grind narrative and more useful: health and performance are the same signal measured at different resolutions.
Your strength numbers, your VO2 Max, your repeat effort capacity — that is what the system can produce. Your bloodwork — inflammation, hormones, metabolic markers — that is what it costs. When both trend in the same direction, you are compounding. When they diverge, you are borrowing.
And the debt always collects.
TWO DASHBOARDS. ONE SYSTEM.
Think of it as a battle damage assessment for your own biology.
Dashboard one: Output Oriented. Strength. Power. Aerobic Capacity and Biomechanics under Fatigue. This tells you what you can do.
Dashboard two: Cost. hs-CRP. Free testosterone-to-cortisol ratio. Fasting insulin. Ferritin. DHEA-S. HRV trend. This tells you what you’re paying for it.
Most athletes only read dashboard one. They PR. They perform. They look capable.
Underneath, inflammatory markers are climbing, hormonal profiles are inverting, and metabolic health is eroding.
The performance is real. It is also rented.
Zelenkova’s 2019 systematic review confirmed it: performance gains paired with worsening biomarkers reverse within four to eight weeks. Every time. The body does not let you run a deficit indefinitely.
Any coach can make you tired. Any program can run you into the ground and call the output progress. That is not mastery. Mastery is seeing performance rise while health markers hold or improve. That is controlled adaptation.
That is the art.
WHEN CROSSING THE LINE IS THE MISSION
Now, there are moments when the demands of an event will push you out of equilibrium. An over-reaching block in the preparation phase. A selection pipeline. A season where the stakes require everything you have.
Those moments are real. They are also defined. They have a start date, an end date, and a recovery plan. The East German periodization system built explicit stabilization phases after every intensification block — not as rest, but as consolidation.
The push was planned. The return to baseline was planned. Neither existed without the other.
The problem is not the incursion. The problem is when the incursion becomes the baseline. When every month is a peak. When borrowed performance becomes the operating system.
That is not high performance.
That is a debt, with a training plan attached to it.
THE AUDIT
At Carbon, we run performance metrics and blood panels side by side. Every 3-6 months. No exceptions. We call it the High Performance Audit, and it reduces to a single question: are your two dashboards telling the same story?
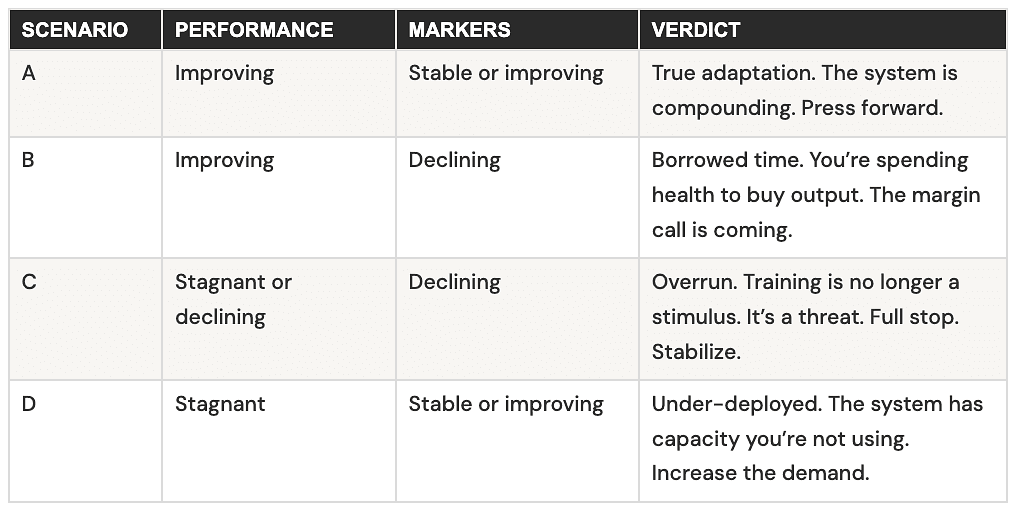
Eighty percent of the athletes we assess for the first time are in Scenario B. Performance looks strong. Markers tell a different story. Chronic low-grade inflammation. Depressed adrenal reserve. Hormonal trends moving in the wrong direction.
Not catastrophic numbers but trends. And trends are what end careers — not overnight, but over the two or three years you spent confusing output with adaptation.
RUN IT YOURSELF
Step 1. Baseline your output. Strength test. VO2 Max, LT, or surrogate. Body composition. Biomechanics. HRV average. Date it.
Step 2. Run the panel. Minimum: hs-CRP, fasting glucose and insulin, free and total testosterone, cortisol (AM draw), DHEA-S, ferritin, vitamin D, thyroid, lipids with triglyceride-to-HDL ratio, liver enzymes. That is 80% of what you need.
Step 3. Two columns. Performance on the left. Markers on the right. For every domain — strength, aerobic capacity, composition, recovery, movement — ask one question: same story, or different story?
Step 4. Repeat every 3-6 months. One draw means nothing. Four draws across 1-2 years reveal the trend. And the trend is the truth that single snapshots hide.
THE STANDARD
Improve your strength but show me your inflammation is handled.
Run more, but show me your hormones support it.
Compete harder. Show me the recovery/stability in the plan that brings the markers back inside the window.
That is the standard. Not output alone. Not health alone. Both. Verified.
The athlete who pays attention to both has longevity.
The other has a highlight reel and a medical file.
Do both.